CryptoMox Blog
A Guide to Algorithmic Trading Strategies
Algorithmic trading is really just about using pre-built instructions to let a computer handle the grunt work of placing trades. The system automatically buys or sells based on specific rules you set, whether they're related to price, volume, or even the time of day. This frees traders from being glued to their screens, allowing them to execute strategies with a speed and consistency that's impossible to achieve manually.
The core idea is to take human emotion out of the equation and profit from market moves far more efficiently than any person ever could.
So, What Exactly Is Algorithmic Trading?
Think of it like having an incredibly disciplined trading partner who never sleeps, never gets greedy or fearful, and executes your game plan with inhuman precision. That's what algorithmic trading is all about. It’s a method where you give a computer a set of rules—an algorithm—and it places trades for you.
Instead of staring at charts and manually clicking "buy" or "sell," you define the exact conditions for a trade to happen. The algorithm then scans the market 24/7, tirelessly waiting for those conditions to pop up. This shifts trading from a world of gut feelings and emotional guesswork to one grounded in a logical, data-driven framework.
The Building Blocks of a Trading Algorithm
At its heart, every trading algorithm operates on a simple "if-this-happens, then-do-that" logic. The rules can range from incredibly simple to mind-bogglingly complex, but they all boil down to three key parts:
Signals: These are the triggers that tell the algorithm it's time to act. A signal could be a technical indicator like the RSI crossing a certain level, a specific chart pattern taking shape, or even a particular keyword appearing in a news feed.
Execution Logic: This is the "what to do" part. Once a signal fires, the execution logic dictates the order type (market or limit), the direction (buy or sell), and which asset to trade.
Risk Management: Think of these as the built-in safety nets. A solid algorithm always has rules for setting stop-losses to cap your downside and take-profit levels to lock in gains automatically.
For example, a basic trend-following algorithm might have this rule: If Bitcoin's 50-day moving average crosses above its 200-day moving average (the signal), then buy 1 BTC and immediately place a stop-loss 2% below the entry price (the execution and risk logic).
Actionable Insight: Start simple. Your first algorithm doesn't need to be complex. A basic moving average crossover system is a great way to learn the fundamentals of defining signals, execution, and risk before adding more layers.
This shift toward automation isn't just a niche trend; it's fundamentally changing how financial markets work. The global algorithmic trading market was valued at USD 21.06 billion in 2024 and is on track to nearly double to USD 42.99 billion by 2030, largely driven by advances in machine learning and AI. You can dig into the numbers yourself in this algorithmic trading market report.
This guide will break down the key algorithmic trading strategies that are powering this industry, from chasing major trends to capitalizing on tiny price reversals. Let's get started.
A Look at Core Algorithmic Trading Strategies
When you get into algorithmic trading, you quickly discover it's a world filled with distinct playbooks. Each strategy is a carefully crafted system designed to capitalize on a specific, repeatable type of market behavior. These aren't just wild guesses; they're logical, rules-based approaches that translate a market hypothesis into cold, hard code.
At the end of the day, every strategy boils down to a core belief about how prices move. One system might bet that a powerful trend will keep running, while another might wager that a price stretched too far will inevitably snap back. The real trick is turning that belief into a concrete set of instructions a computer can execute flawlessly, over and over again.
Momentum Trading: Riding the Wave
Momentum trading is probably the most intuitive strategy out there. The logic is straightforward: assets that are already doing well will likely keep doing well, and those doing poorly will continue to do so. It’s the classic "the trend is your friend" philosophy, but automated for speed and discipline.
A momentum algorithm scans for assets with strong price movements—up or down—and essentially hops on for the ride. The signals are usually tied to the rate of price change over a set period or a clean break above a key resistance level.
Actionable Example:
A momentum bot watching Bitcoin could use the following rules:
Entry Signal: Buy if BTC's price closes above its 20-day high for two consecutive days.
Exit Signal (Take Profit): Sell 50% of the position if the price rises 10% from entry.
Exit Signal (Stop-Loss): Sell the entire position if the price closes below the 10-day moving average.
The goal here is to catch those powerful upward thrusts and exit as soon as that initial momentum shows signs of fading.
Mean Reversion: Betting on the Snap-Back
Mean reversion is the polar opposite of momentum. This strategy is built on the idea that prices, much like volatility, eventually return to their long-term average. It’s like a rubber band—stretch it too far, and it's bound to snap back.
These algorithms are constantly on the hunt for assets that have made an extreme move away from their historical average. If a price shoots up to an unusually high level, the algorithm will short it, betting on a fall. If it plummets to an unusually low level, it buys, anticipating a rebound.
The core concept here is statistical deviation. Mean reversion strategies lean heavily on indicators like Bollinger Bands or the Relative Strength Index (RSI) to get a mathematical read on when an asset is "overbought" or "oversold." This gives the algorithm a clear, data-driven trigger for a trade.
Actionable Example:
Imagine a mean reversion bot for Ethereum. It might be programmed with these rules:
Entry Signal: Buy ETH if its price touches the lower Bollinger Band and its 14-period RSI drops below 30.
Exit Signal (Take Profit): Sell the position as soon as the price crosses back above the 20-period moving average (the middle band).
Exit Signal (Stop-Loss): Sell if the price drops 2% below the entry price to guard against a continuing downtrend.
Statistical Arbitrage: Exploiting Small Price Gaps
Statistical arbitrage, often called "stat arb," is a more sophisticated approach that looks for profits in the tiny pricing inefficiencies between related assets. Instead of betting on where the whole market is headed, these algorithms hunt for temporary mispricings between a pair or a group of assets that usually move in sync.
For example, two cryptocurrencies in the DeFi space often have correlated prices. If one suddenly drops while the other holds steady, a stat arb algorithm might buy the underperformer and short the outperformer. The entire trade is a bet that their historical relationship will kick back in and the price "spread" between them will shrink back to normal.
Actionable Example:
An algorithm could monitor the price ratio between two correlated crypto assets, like UNI and CAKE.
Rule: If the historical UNI/CAKE price ratio is 1.5, the bot takes action when it deviates.
Entry Signal: If the ratio widens to 1.7 (meaning UNI is outperforming), the bot shorts UNI and buys CAKE.
Exit Signal: The bot closes both positions when the ratio returns to its average of 1.5.
The constant demand for faster execution is a huge driver in this space, with some analysts expecting the algorithmic trading market to hit USD 6.05 billion by 2032. You can dig into a detailed forecast of the algorithmic trading market to get a sense of its growth.
Market Making: Cashing in on Liquidity
Market-making algorithms are the grease in the market's wheels. They provide liquidity by placing both buy (bid) and sell (ask) orders at the same time for the same asset. Their profit comes from the tiny difference between those two prices, known as the bid-ask spread.
A market-making bot doesn't care which way the market is going. Its job is to be the person on the other side of the trade for both buyers and sellers, capturing a small but consistent profit from a huge number of transactions. This requires some pretty smart risk management to avoid accidentally building up a big position in one direction.
Actionable Example:
A market-making bot for an asset trading at $100 might operate like this:
Orders: Continuously place a buy order at $99.99 (the bid) and a sell order at $100.01 (the ask).
Profit: If both orders are filled, the bot makes $0.02 per unit.
Inventory Management: If the bot buys 100 units but only sells 20, it might automatically lower both its bid and ask prices slightly to encourage selling and discourage more buying, keeping its inventory neutral.
Each of these strategies offers a completely different lens through which to view the markets. The right one for you will come down to your risk appetite, your technical skills, and the specific market conditions you’re trying to tackle.
To make things clearer, let's break down how these core strategies stack up against each other.
Comparison of Core Algorithmic Trading Strategies
The table below gives you a quick side-by-side look at the main algorithmic approaches, highlighting their fundamental logic and where they tend to perform best.
| Strategy | Core Logic | Ideal Market Condition | Typical Timeframe |
|---|---|---|---|
| Momentum | An object in motion stays in motion. Buy high, sell higher. | Strong, trending markets (up or down). | Medium to Long-Term (Days to Months) |
| Mean Reversion | What goes up must come down (to the average). Buy low, sell high. | Ranging or choppy markets with no clear trend. | Short to Medium-Term (Minutes to Days) |
| Statistical Arbitrage | Profit from temporary price differences between related assets. | Any condition with temporary pricing inefficiencies. | Very Short-Term (Milliseconds to Hours) |
| Market Making | Profit from the bid-ask spread by providing liquidity. | Stable markets with consistent trading volume. | Extremely Short-Term (Microseconds to Seconds) |
Getting a solid handle on these foundational models gives you a powerful framework for analyzing the market. From here, you can start to figure out which approach truly clicks with your own trading philosophy and long-term goals.
How to Build and Backtest Your Strategy
An idea for a trading strategy is just a spark. The real work is turning that spark into a robust, automated system that can actually navigate the markets. This process is all about moving from a simple hypothesis to a rigorously tested algorithm, giving you a statistical edge before you put any real money on the line.
The journey starts with spotting what you think is a market inefficiency. Maybe it's a price pattern that seems to repeat itself, a predictable overreaction to news, or a strange relationship between two different assets. Once you have that hunch, the next step is to nail down the rules with absolute clarity, transforming your gut feeling into objective, programmable logic.
From Hypothesis to Code
Building an algorithm is like writing a recipe for a robot chef—you have to specify every single ingredient and every step with zero ambiguity. A computer only does exactly what it's told, so your entry and exit signals need to be defined with mathematical precision.
This is where the rubber meets the road. You’re turning abstract concepts into concrete, actionable rules.
Define Your Entry Signal: What specific, measurable event has to happen for your bot to open a trade? It can’t be something vague like "the market looks bullish." It has to be a hard condition, like "the 5-minute RSI must cross below 20."
Define Your Exit Signals: Every trade needs an exit plan. You’ll need two: a take-profit rule (e.g., "sell when the price hits the upper Bollinger Band") and a non-negotiable stop-loss (e.g., "get out immediately if the price drops 1.5% below our entry").
Choose Your Tools: How will you build it? You could go with a no-code platform that lets you drag and drop indicators and logic blocks. Or, you could roll up your sleeves and code the strategy from scratch in a language like Python, tapping into its powerful data analysis libraries.
The growing accessibility of these tools is a huge reason the market is expanding so quickly. The global algorithmic trading market was valued at USD 51.14 billion in 2024 and is projected to nearly triple to USD 150.36 billion by 2033, as more institutions and everyday traders get in on the action. You can dig into the full analysis on the algorithmic trading market's future growth.
The Critical Role of Backtesting
Once your algorithm is built, it's time for backtesting. This is where you simulate your strategy on historical market data. Think of it as a time machine that lets you see how your brilliant recipe would have actually performed over the last few years—through bull runs, crashes, and all the choppy sideways action in between.
But here’s the key: backtesting isn't about finding a strategy that would have made you a millionaire yesterday. It's about stress-testing your logic to understand its real DNA—its true risk and reward profile.
Actionable Insight: Run your backtest across multiple time periods and market conditions. A strategy that only works in a bull market is a broken strategy. Test it on data from 2018, 2021, and 2023 to see how it handles bull, bear, and choppy environments.
A solid backtest will spit out a report full of performance metrics. While you can get lost in the data, a few metrics are absolutely essential for judging any of the algorithmic trading strategies you come up with.
Interpreting Key Performance Metrics
To really get what your strategy is about, you have to look past the final P&L number. These key metrics paint a much richer picture of its behavior and whether it's actually viable for the long haul.
Sharpe Ratio: This is the classic measure of risk-adjusted return. A higher Sharpe Ratio (anything over 1.0 is generally considered pretty good) means you're getting more bang for your buck in terms of the risk you're taking.
Maximum Drawdown: This one is a gut check. It’s the biggest peak-to-trough drop your account would have suffered during the test. It shows you the most pain you would have had to endure before things turned around.
Win Rate vs. Profit Factor: A high win rate feels great, but it can be totally misleading. What really matters is the Profit Factor (gross profit divided by gross loss). This number tells you how many dollars you make for every single dollar you risk.
Avoiding the Overfitting Trap
The single biggest danger in backtesting is overfitting. This is what happens when you tweak your strategy's parameters so perfectly that it crushes the historical data, but then it completely falls apart in live trading.
It’s like someone giving you the answer key to last year's final exam. You’ll ace that specific test, but you won't actually know how to solve any new problems.
To sidestep this trap:
Use Out-of-Sample Data: Always test your strategy on a chunk of data it wasn't built on. For example, if you build your strategy using data from 2020-2022, validate its performance on 2023 data.
Keep It Simple: The more moving parts and complicated rules you add, the more likely you are to be overfitting.
Be a Skeptic: If a backtest looks too good to be true with zero losing streaks, it probably is. Real markets are messy.
By following this structured approach, you can methodically develop and validate your trading ideas, turning a promising concept into a resilient system that's built on data, not just hope.
Managing Risk and Sizing Your Positions
You can have the best trading strategy in the world, one that predicts market moves with uncanny accuracy, and still blow up your account. How? By failing to manage risk. A single, poorly sized trade that goes bad can erase weeks of careful gains. This is why pros know that capital preservation is the real name of the game.
Think of risk management and position sizing as the brakes and steering wheel of your trading operation. They work hand-in-hand to make sure no single trade can ever knock you out of the game. Risk management tells you where to get out when you're wrong. Position sizing tells you how much to bet in the first place. Nailing this combination is what separates the flash-in-the-pan traders from those who build lasting wealth.
Setting Intelligent Stop-Losses
A stop-loss is your pre-defined exit point. It's your "I was wrong" line in the sand. Many beginners just slap a generic percentage on it, like a 2% stop-loss. The problem? That approach is completely blind to the market's current personality.
A 2% stop might be perfectly fine in a sleepy, sideways market. But during a period of high volatility, that same 2% could get you knocked out of a perfectly good trade just due to normal, noisy price swings. You get stopped out, only to watch the market rip in your intended direction without you. It's frustrating.
A much smarter way is to let the market itself tell you where your stop should be. This is where an indicator like the Average True Range (ATR) becomes your best friend.
- Average True Range (ATR): This isn't a directional indicator. It simply measures volatility. A high ATR means big, choppy price swings are the norm; a low ATR means things are quiet.
Actionable Example: Instead of a fixed 2% stop, you can set a dynamic one.
Rule: Set the initial stop-loss at a distance of 2x the current 14-period ATR below your entry price.
Benefit: This gives your trade enough room to breathe when the market is wild but keeps things tight when it's calm, preventing premature stop-outs.
Calculating Your Position Size
Okay, so you know exactly where your stop-loss will go. Now you can figure out how big your position should be. This is arguably the most important decision you'll make in any trade. The goal is simple: if you get stopped out, the loss should be a small, completely acceptable fraction of your total capital.
One of the most battle-tested models for this is the fixed-fractional method, better known as the "1% rule."
The 1% Rule: This isn't just a guideline; it's a career-saver. It means you will never risk more than 1% of your total trading account on a single idea. By sticking to this, you could suffer a gut-wrenching string of ten, fifteen, even twenty losses in a row and still be in the game.
To put this into practice, you just need three numbers:
Total Account Equity: How much money is in your trading account?
Risk Per Trade: The percentage you're willing to lose (we're using 1%).
Trade Risk (Stop Distance): The dollar amount you'll lose per share or coin if your stop gets hit. Just subtract your stop-loss price from your entry price.
Putting It All Together With an Example
Let's see how this works with real numbers. It’s simpler than it sounds.
Say you're working with a $25,000 account and you're sticking to the 1% rule.
Total Account Equity: $25,000
Risk Per Trade: 1% (which is $250)
You spot a great long setup in an asset trading at $50. After checking the ATR, you decide a logical place for your stop-loss is $48.
Entry Price: $50.00
Stop-Loss Price: $48.00
Trade Risk (per unit): $50.00 - $48.00 = $2.00
Now we can figure out exactly how many units to buy with a simple formula:
Position Size = (Total Equity x Risk %) / (Entry Price - Stop Price)
Let's plug in our numbers:
Position Size = ($25,000 x 0.01) / $2.00 = $250 / $2.00 = 125 units
The math tells you to buy 125 units. Now, if the trade moves against you and your stop at $48 is hit, your loss will be 125 units x $2.00 = $250. That's exactly 1% of your account, just as you planned.
By doing this every single time, you turn risk from a terrifying unknown into just another variable in your trading equation—one that you completely control.
Putting CryptoMox Analytics Into Action
Great trading strategies are one thing, but they're only as good as the data you feed them. This is where you can get a serious edge. By plugging advanced analytics into your decision-making, you can move beyond old-school lagging indicators and start building algorithmic trading strategies that are genuinely forward-looking and can adapt on the fly.
Instead of just looking in the rearview mirror at past price action, you can use predictive tools to get smarter about your entries, exits, and even how much you risk on each trade. Let's walk through how to use specific CryptoMox analytics to bring those risk management and trade planning concepts to life.
Using Forward-Looking Projections for Smarter Targets
Let's be honest—setting a profit target can feel like guesswork. We often fall back on arbitrary risk-to-reward ratios or static support and resistance lines. CryptoMox’s forward-looking projections give you a much more data-driven way to set your sights. These projections forecast a likely price path, offering a statistically grounded zone to aim for.
Actionable Example:
You get a long signal for BTC/USDT at $65,000. Instead of setting an arbitrary $67,000 target, you check the CryptoMox 1-hour projection, which indicates a probable price ceiling of $66,500. You can now set your take-profit order at $66,450, just inside that zone. Suddenly, your target isn't a random guess; it's anchored to a predictive model.
Dynamic Stop-Losses with Conviction Bands
In a volatile market, a static stop-loss is often a recipe for getting shaken out of a good trade. This is where CryptoMox’s conviction bands come in. Think of them as a dynamic, intelligent guide for where to place your stop. The bands automatically widen and narrow based on the AI’s confidence in the current trend, giving you a clear visual on market volatility.
Think of conviction bands as an intelligent, adaptive version of the ATR. When the bands are wide, it’s a sign of high uncertainty or volatility—a cue to give your trade more breathing room with a wider stop. When they’re tight, it signals a strong, confident trend, letting you place a tighter stop to lock in profits.
Actionable Example:
Imagine you go long on ETH/USDT. Instead of setting a fixed 2% stop, you place your initial stop-loss just below the lower conviction band. As the price moves your way and the bands creep upward, you trail your stop right along with them. This simple technique helps you ride a winner for all it's worth while still protecting your downside if the trend suddenly snaps.
Adjusting Position Size with Confidence History
The standard "risk 1% per trade" rule is a fantastic starting point for protecting your capital. But it has one flaw: it treats every trade as having the same odds of success. The confidence history metric in CryptoMox lets you get much more sophisticated with your position sizing. It gives you a straightforward score showing how certain the model is about its current forecast.
A high confidence score—say, above 75%—tells you the model’s prediction lines up perfectly with how it’s performed in similar situations in the past. A low score, on the other hand, signals a lot more uncertainty.
You can use this to adjust your risk in real-time:
High Confidence (>75%): For a trade signal with high model conviction, you might risk your full 1%.
Moderate Confidence (50-75%): Stick to your standard 1% risk. No need to get fancy.
Low Confidence (<50%): Protect your capital. Scale back your risk to just 0.5% for this trade, or perhaps skip it altogether.
This entire process is about putting risk first. You size your position, set your protective stop, and only then do you execute the trade.
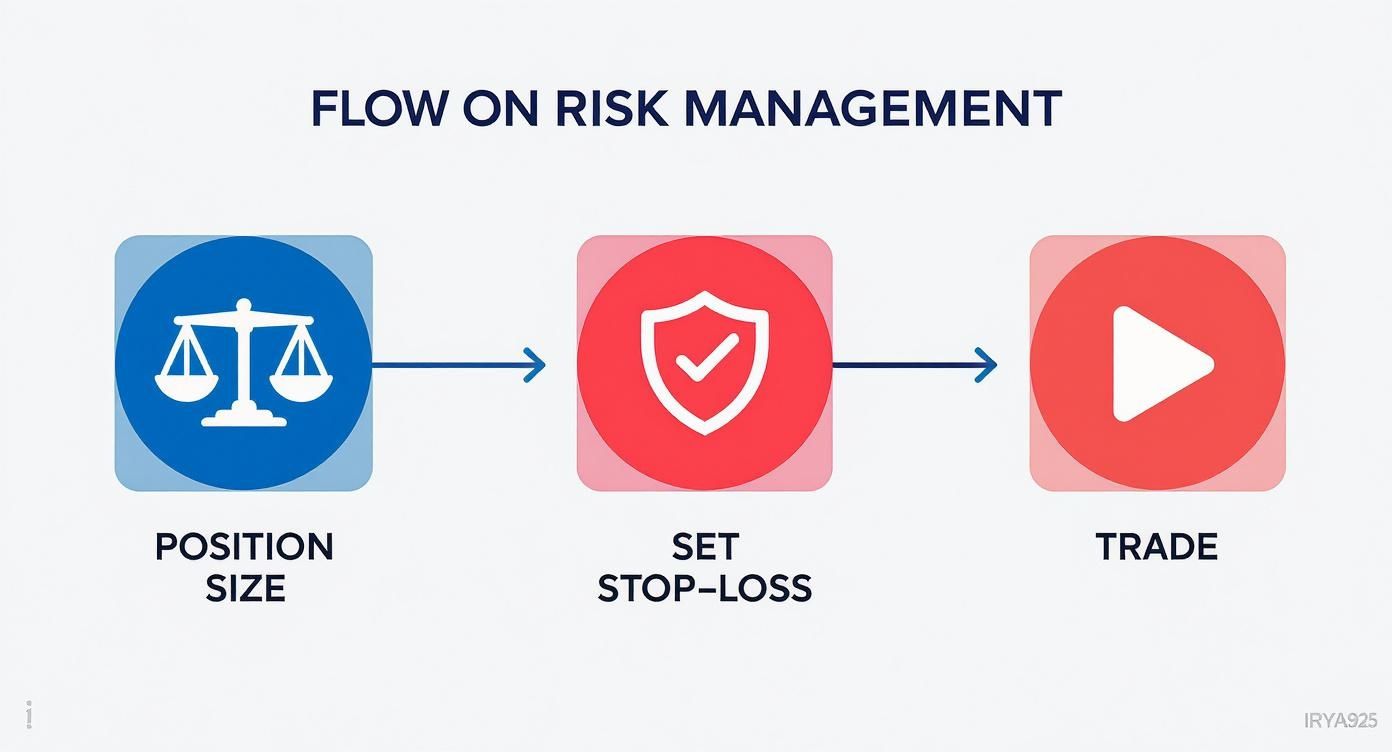
By always following this sequence, you ensure that your risk is calculated and under control before a single dollar is put on the line.
Frequently Asked Questions About Algorithmic Trading
When you first step into the world of automated trading, a handful of questions always seem to pop up. Let's tackle some of the most common ones that new and experienced traders alike grapple with.
How Much Capital Do I Really Need to Start?
There’s no one-size-fits-all answer here. The amount of money you need is tied directly to your strategy and the markets you want to trade. For some crypto or forex strategies, especially simpler ones that don't juggle many open positions, you could technically get started with just a few hundred dollars.
Actionable Insight: A good rule of thumb is to start with an amount where risking 1% per trade still covers transaction fees comfortably. For example, if your average fees are $5 per trade, your 1% risk should ideally be at least $10-$15. This suggests a minimum starting capital of around $1,000-$1,500 to avoid fees eating into your edge.
What's the Best Programming Language for an Algo Trader?
For the vast majority of traders, both retail and institutional, Python is the king. Its true strength lies in its massive collection of libraries built for data analysis (like Pandas and NumPy), machine learning, and backtesting. Plus, its straightforward syntax makes it relatively easy to pick up and start building new ideas quickly.
That said, if you're playing in the high-frequency trading (HFT) arena where every microsecond counts, C++ is the go-to. You simply can't beat its raw speed and low-level system control.
Actionable Insight: Don't know how to code? Start with a no-code or low-code platform like TradingView (with Pine Script) or dedicated crypto bots. This allows you to test strategic ideas and understand algorithmic logic without needing to become a software developer first.
Can Algorithmic Trading Actually Be Consistently Profitable?
Absolutely, but let's be clear: it's not a "set it and forget it" money printer. Achieving consistent profitability is the product of tireless effort, not a single brilliant algorithm. It all starts with a deep understanding of how markets behave and a statistically solid strategy that gives you a genuine edge.
That edge has to be proven through exhaustive backtesting and then guarded with ironclad risk management. And remember, markets are constantly evolving. Even a winning strategy can lose its effectiveness over time—a phenomenon known as alpha decay.
The truly successful algo traders are never finished. They are in a perpetual cycle of research, testing, and refinement, always monitoring their systems, developing new ideas, and adapting to whatever the market throws at them. Profitability isn't a final destination; it's a process of constant improvement and discipline.
Ready to stop guessing and start building a data-driven trading process? CryptoMox delivers the forward-looking analytics you need to craft a smarter plan. Start your secure 7-day trial and see the future of your trades.