CryptoMox Blog
How to Read Crypto Charts: A Trader's Essential Guide
If you've ever felt like you're just guessing when you look at a crypto chart, you're not alone. The first real step toward consistent trading is learning to read the story the market is telling you. This story is written in the language of price action and volume.
Decoding the Language of Crypto Charts
Before diving into complex strategies, you need to get comfortable with the absolute basics. Think of it like learning the alphabet. On any given chart, this alphabet has two key letters: candlesticks and volume. Everything else you learn will build on this foundation.
These two elements give you a raw, unfiltered look at the tug-of-war between buyers (bulls) and sellers (bears). They show you who's winning, who's losing, and how much conviction is behind each move.
To give you a quick reference, here are the core components you'll find on nearly every chart.
Core Chart Components at a Glance
| Component | What It Tells You | Why It Matters |
|---|---|---|
| Candlesticks | The open, high, low, and close price for a specific period. | Shows the intensity of buying or selling pressure and potential market reversals. |
| Volume | How much of an asset was traded during that period. | Confirms the strength or weakness of a price move. High volume adds conviction. |
| Trend | The overall direction the price is moving (up, down, or sideways). | Helps you trade with the market's momentum instead of fighting against it. |
| Support/Resistance | Price levels where buying or selling pressure has historically been strong. | Identifies key areas where price is likely to pause, reverse, or break out. |
Understanding these pieces is your starting point for building a solid trading plan. Let's break down the first two in more detail.
What Candlesticks Reveal About Price Action
A candlestick is so much more than just a red or green bar. It’s a snapshot of the market’s psychology during a specific timeframe, whether it's one minute or one day. Each candle gives you four critical pieces of information:
- Open: Where the price started.
- High: The peak price reached.
- Low: The bottom price reached.
- Close: Where the price finished.
The thick part, or the "body," shows you the distance between the open and close. If the price closed higher than it opened, the candle is typically green (bullish). If it closed lower, it's red (bearish).
The thin lines sticking out are called "wicks" or "shadows," and they show the full range of the price action. A long green candle with tiny wicks shouts strong, confident buying. On the other hand, a candle with a small body but long wicks on both ends signals a battle royale between buyers and sellers, with no clear winner. That’s pure indecision.
Actionable Example: Imagine you see a long red candle after a big price run-up. This isn't just a down period; it's a "bearish engulfing" candle, signaling that sellers have aggressively stepped in and overwhelmed the buyers. Seeing this pattern near a resistance level is an actionable insight to consider taking profits or tightening your stop-loss.
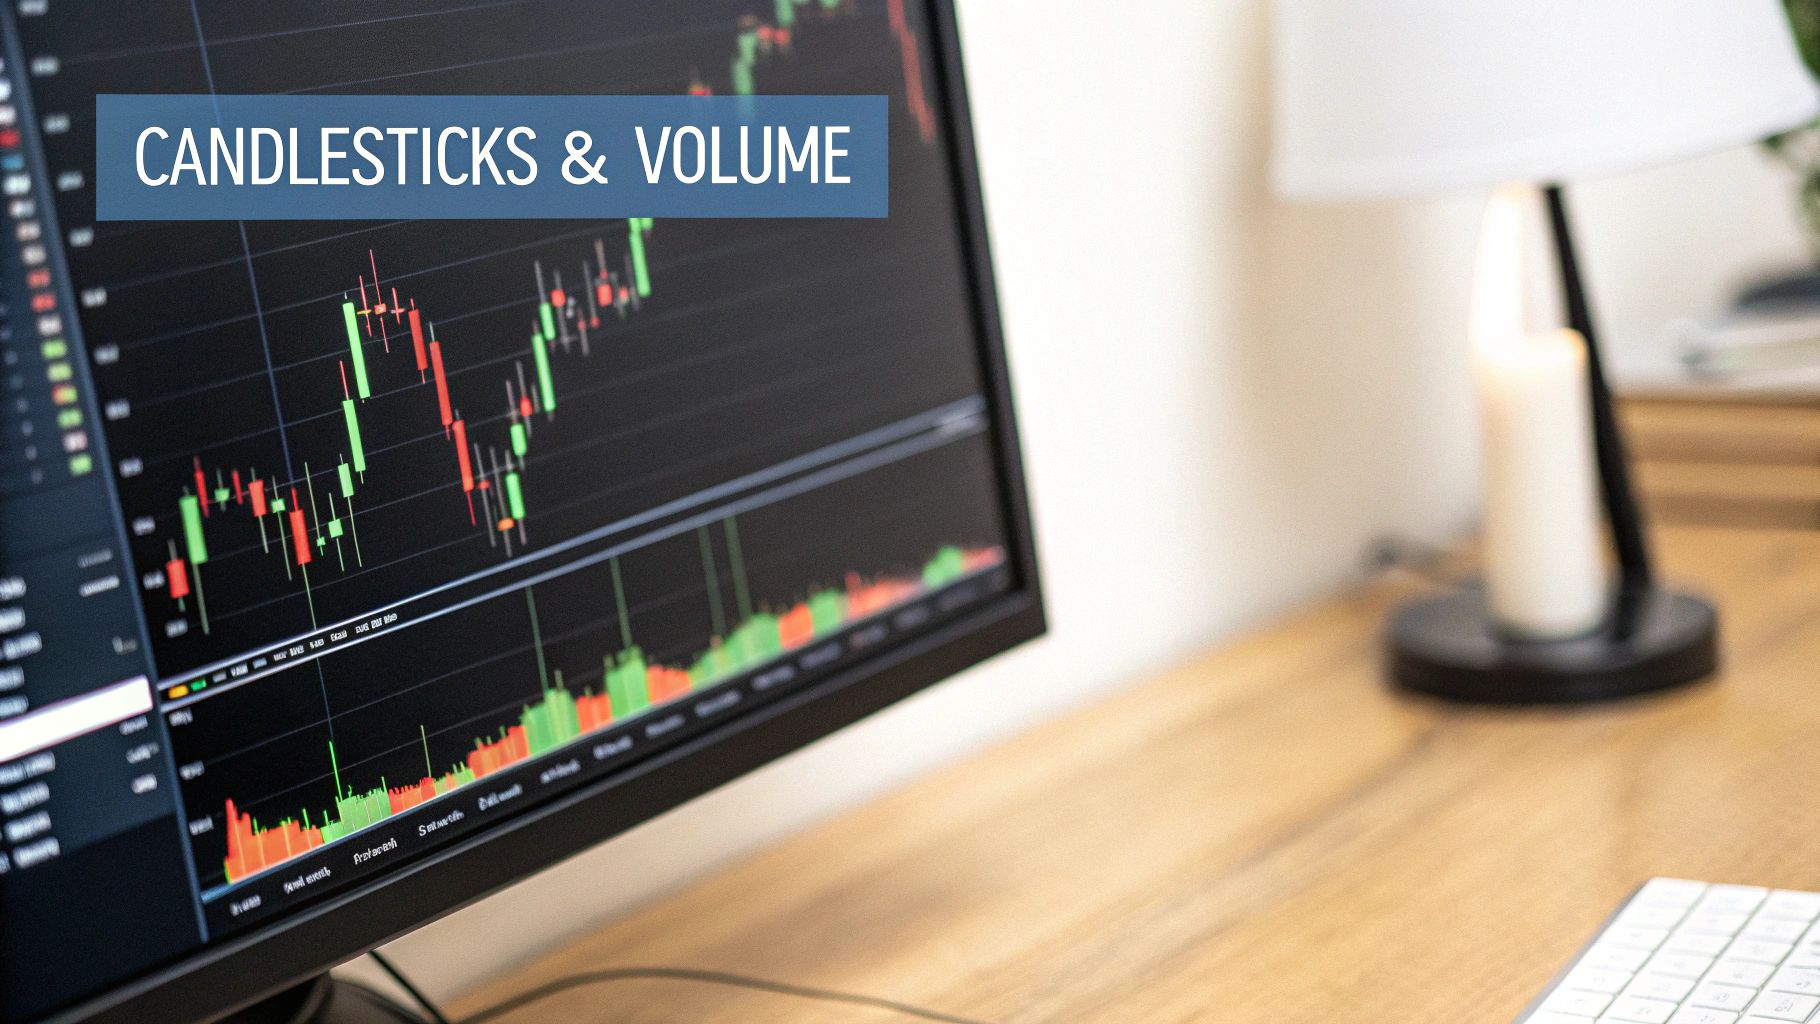
Why Trading Volume Confirms Your Analysis
Look below the price candles, and you’ll see the volume bars. This is your truth meter. Volume tells you how many people are participating in a price move, revealing the conviction behind it.
Imagine a huge price spike. Is it real? Look at the volume. If that spike happened on massive volume, it means a lot of traders believed in that move, giving it legitimacy. But if the same spike occurred on weak, anemic volume, be suspicious. That could be a "fakeout" designed to trap eager traders.
Actionable Insight: When a crypto breaks out of a key price level (resistance), look for a corresponding spike in volume. A high-volume breakout confirms strong buying interest and increases the odds that the move is sustainable. A low-volume breakout is a red flag that the move may fail and reverse back down. Always wait for volume confirmation before trusting a breakout.
Mastering the interplay between price and volume is non-negotiable. In fact, the ability to properly interpret these signals can improve predictive accuracy by up to 70%. If you want to dive deeper into how traders use this data, check out this detailed consumer report on crypto trading habits.
Using Technical Indicators for Deeper Insights
Candlesticks and volume give you the raw story of what’s happening right now. But to understand the why and get a glimpse of what might happen next, you need to bring in some technical indicators.
Forget about plastering your chart with dozens of confusing lines. For our purposes, we're going to focus on two of the most reliable and time-tested tools in a trader's arsenal: Moving Averages (MA) and the Relative Strength Index (RSI).
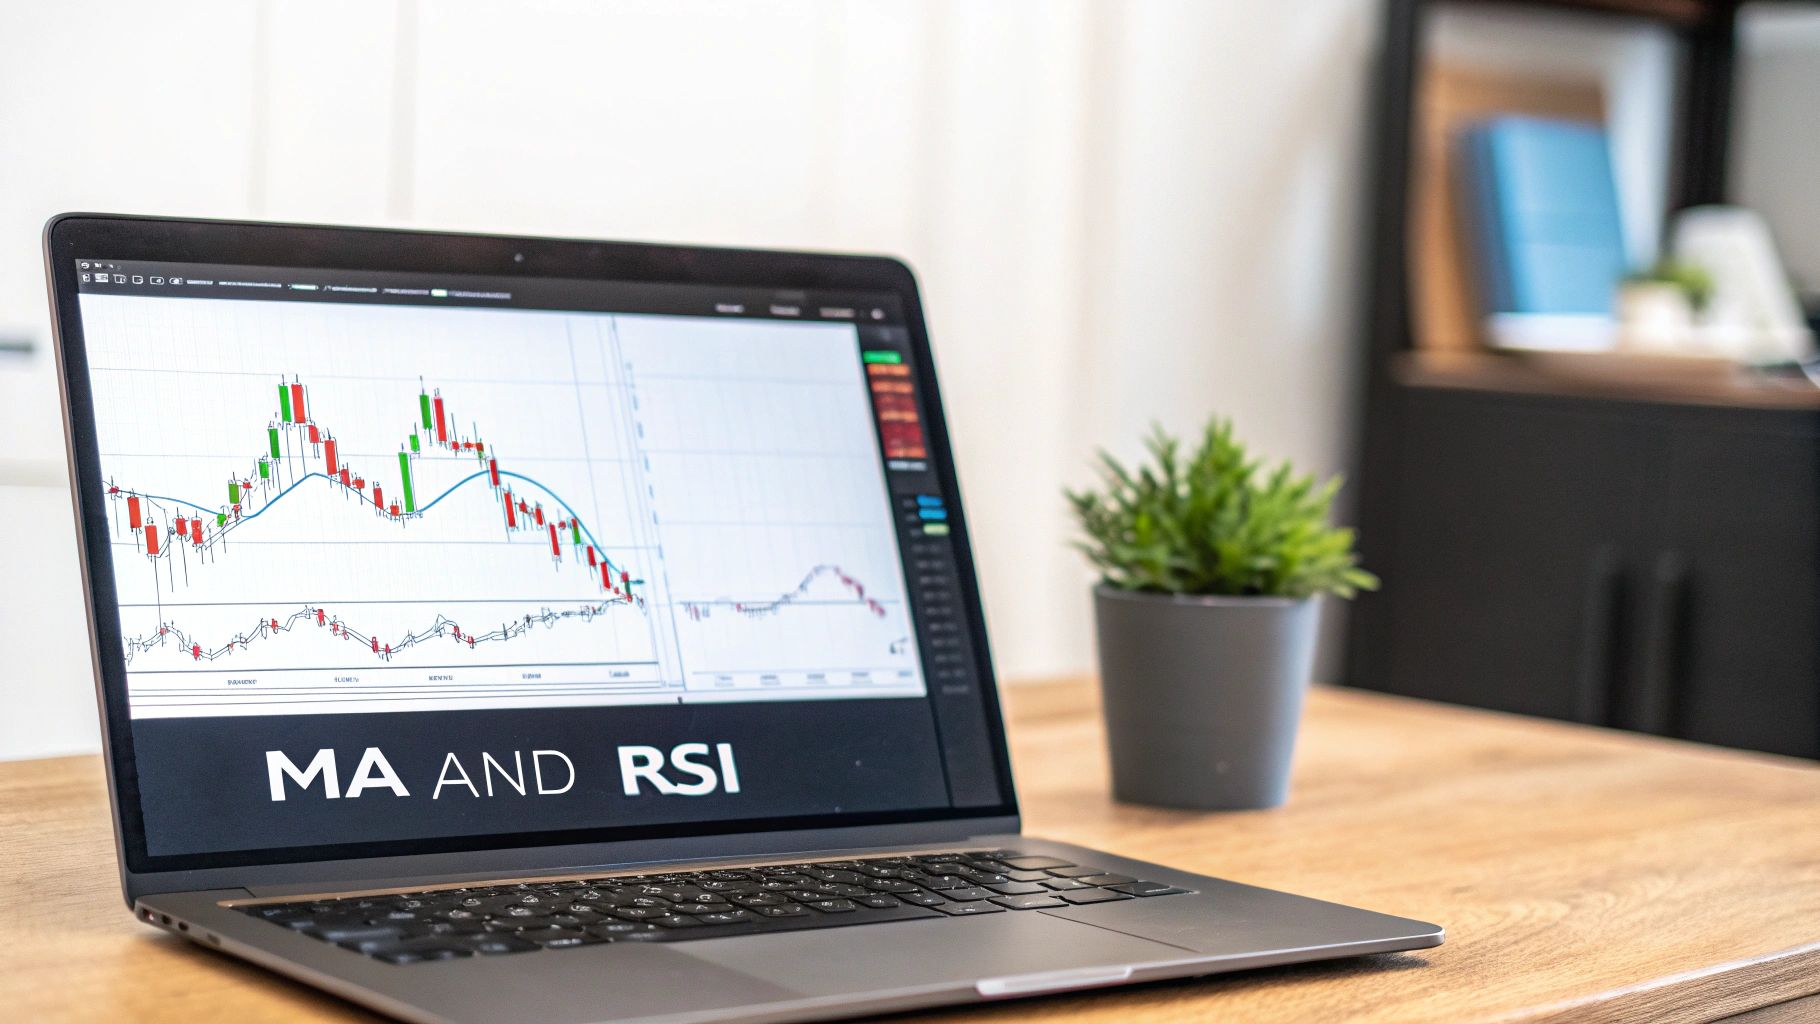
These two work beautifully together. Moving averages help you nail down the overall trend and spot potential support or resistance, while the RSI acts as your momentum gauge, warning you when a trend might be running out of gas.
Using Moving Averages to Define the Trend
A moving average is simply the average price over a set period, which smooths out the day-to-day noise and gives you a much clearer picture of the underlying trend. When learning how to read crypto charts, two MAs are absolutely essential:
- The 50-period MA: This is your guide to the medium-term trend. On a daily chart, it reflects the market's sentiment over the last couple of months.
- The 200-period MA: Think of this as the line in the sand for the long-term trend. Big-money institutions watch this level like a hawk; its direction often defines whether we're in a bull or bear market.
When the price is holding firm above both the 50 and 200 MAs, you're in a clear uptrend. When it's trading below both, the bears are in control. But the real magic happens when these two lines cross.
The Golden Cross and Death Cross Explained
The most powerful signals from moving averages come when they intersect. These events are so important that traders everywhere know them by name.
- The Golden Cross (Bullish Signal): This happens when the short-term 50 MA crosses above the long-term 200 MA. It's a powerful sign that medium-term momentum has flipped bullish, often kicking off a sustained bull market.
- The Death Cross (Bearish Signal): This is the ominous opposite. When the 50 MA slices below the 200 MA, it’s a major red flag that the trend has weakened, potentially signaling the start of a bear market or a deep correction.
Real-World Example: In late 2020, Bitcoin’s daily chart flashed a Golden Cross. For traders who knew what to look for, this was a massive confirmation that a new bull run was starting. What followed was a rally that sent prices soaring over 500%. That signal gave savvy traders the confidence to get positioned for a historic move.
Measuring Momentum with the Relative Strength Index (RSI)
Moving averages tell you the direction of the trend; the RSI tells you about its strength. The RSI is a momentum oscillator, displayed as a value between 0 and 100, that measures how quickly the price is moving. It's your early warning system for trend exhaustion.
Here are the key levels you need to watch:
- Overbought (RSI above 70): This means the price has gone up too far, too fast, and might be due for a pullback. It’s a warning sign to avoid chasing new long positions.
- Oversold (RSI below 30): This suggests the price has fallen too hard and could be primed for a bounce. This is where you start hunting for potential buying opportunities.
Combining these indicators creates a powerful framework. Think about it: between 2011 and 2025, Bitcoin has posted positive monthly returns 57% of the time. Traders often confirm this general bullish bias with tools like MAs and the RSI before pulling the trigger. If you want to dive deeper into historical data, you can see how statistics shape trading strategies and spot these trends for yourself.
Actionable Example: Let's say an altcoin is in a strong uptrend, trading nicely above its 50 MA. You're tempted to buy, but you glance at the RSI and see it's at 85 on the daily chart—a classic "overbought" reading. Instead of FOMO-ing in at the top, a disciplined trader waits for the RSI to cool off below 70, or even for the price to pull back and retest the 50 MA as support. This simple bit of patience helps you avoid buying into exhaustion and secure a much better entry.
Reading the Market's Structure: Trends, Support, and Resistance
Once you've got a feel for individual indicators, it's time to map the market's overall structure. This is where you graduate from simply watching price action to actually anticipating its next move. By learning to identify key trends, support, and resistance levels, you can build a strategic framework that turns raw chart data into a real trading edge.
These aren't just arbitrary lines on a screen. Think of them as the psychological battlegrounds of the market—the specific price zones where the tug-of-war between buyers and sellers is won and lost. Pinpointing these areas is fundamental to reading a crypto chart like a pro, and it's how you'll find logical spots for your entries, stops, and profit targets.
Following the Flow with Trendlines
Trendlines are one of the simplest, yet most powerful, tools in any trader's arsenal. They cut through the noise of a chaotic chart, revealing the underlying direction of the price and acting as a dynamic boundary for the current move.
A common mistake I see is traders just connecting random dots on a chart. For a trendline to be truly valid, it has to stick to one simple, critical guideline: the two-touch rule.
- In an uptrend: Your line must connect at least two consecutive higher lows. You want to see the price bounce off this line, proving it's acting as a form of dynamic support.
- In a downtrend: The line needs to connect at least two consecutive lower highs. Here, you're looking for the price to get rejected by the line, confirming it as dynamic resistance.
Actionable Insight: Once a trendline has been validated with two touches, the third touch is often a high-probability trading opportunity. For example, in a strong uptrend, if the price pulls back to touch your rising trendline for the third time, it can be a prime entry point for a long position, with a stop-loss placed just below the trendline.
I like to think of an uptrend line as a rising floor the price keeps bouncing on. As long as the price stays above that line, the bulls are clearly in control. A clean, decisive break below it is your first major red flag that the trend is losing steam.
Pinpointing Horizontal Support and Resistance
While trendlines move diagonally with the price, support and resistance are often found in powerful horizontal zones. These are price levels where the market has a strong "memory" of intense buying or selling in the past.
- Support is a price level where demand has historically been strong enough to halt a decline. It’s a "floor" where buyers have previously stepped in with conviction.
- Resistance is the polar opposite—a price "ceiling" where sellers have overwhelmed buyers, forcing the price back down.
Let's look at a real-world Ethereum chart scenario: Imagine ETH runs up to $3,500 and gets smacked down, pulling all the way back to $3,000. A few weeks later, it rallies again but stalls out right at that same $3,500 level. That price has now been validated as a major resistance zone. Smart traders will be watching that ceiling like a hawk, ready for either another rejection or a powerful breakout if it finally punches through.
Remember, these levels are rarely a single, precise line. It's much better to think of them as zones. Price might dip just below a support level before rocketing back up. The real key is to find areas where the price has reversed multiple times, signaling a heavy concentration of buy or sell orders.
The Power of a Role Reversal
One of the most reliable chart patterns you can learn is the concept of role reversal. This is what happens when a broken support level flips and becomes the new resistance, or when old resistance becomes new support. It’s a powerful confirmation that the market's psychology around a specific price has fundamentally changed.
Here’s a classic example of how it plays out:
- Support Breaks: Let's say Bitcoin has been finding solid support around $60,000. After bouncing off it a few times, the price finally slices right through it.
- The Role Reversal: The price then attempts a rally, coming back up to test that $60,000 level, but this time from below. The floor it was standing on has now become its new ceiling.
- Confirmation: If sellers step in and reject the price at $60,000, the role reversal is confirmed. Traders who bought at that level are now trapped in a losing position and will likely use this rally as a chance to sell at their breakeven point, adding even more downward pressure.
Understanding this principle is absolutely critical for managing your trades. If you're long and your key support level gives way, you know the game has changed. And if you then see the price fail to reclaim that level from below, it’s a strong signal that the downtrend has legs, giving you a clear opportunity to get out or even flip to a short position.
Building Your Pre-Trade Analysis Checklist
Being great at reading charts is one thing, but it's only half the game. The most brilliant analysis means nothing if you don't have a repeatable process for putting it into action. This is where a pre-trade checklist saves you. Think of it as the bridge between seeing a setup and actually placing an order. It forces you to be objective and takes the emotion out of the equation.
This isn't about chasing some mythical "perfect" setup. It's about defining your setup—the one you understand and can execute consistently. A checklist makes sure you've nailed down every critical detail before a single dollar is on the line: your entry trigger, your escape plan (the stop-loss), and your exit strategy (profit targets). It’s your best defense against the impulse buys and panic sells that blow up trading accounts.
This simple infographic gives you a visual of the core thought process. You start big with the trend, then zoom in on the key price zones that will frame your trade.
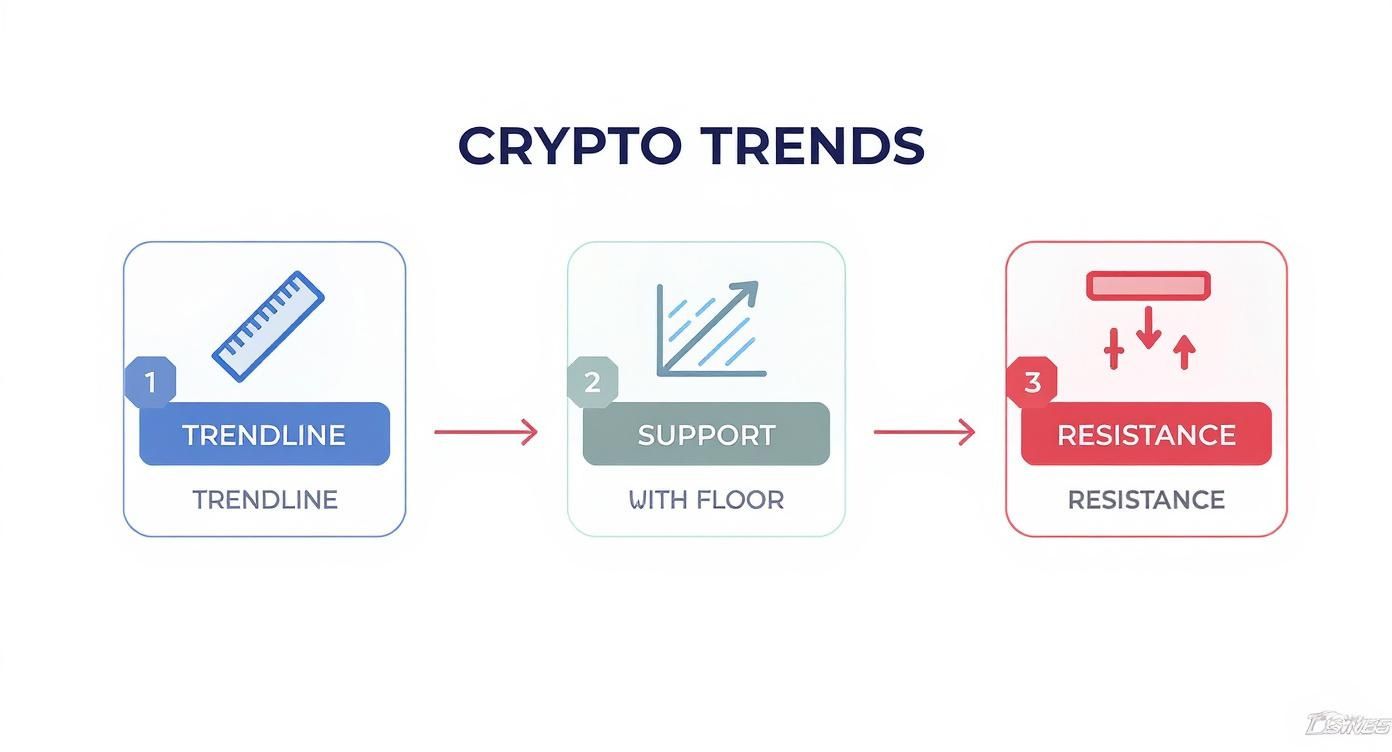
This flow—find the trend, mark the floor (support), and identify the ceiling (resistance)—is the backbone of any solid trading plan.
Defining Your Entry Trigger
Your entry trigger is the specific, non-negotiable event that screams, "Go time!" Vague ideas like, "I'll buy when it looks good," are a fast track to failure. A trigger has to be something concrete you can see on the chart.
Here are a few classic examples:
- Price Action Signal: The price pulls back to a major support level and prints a huge bullish engulfing candle on the 4-hour chart. That’s your signal.
- Indicator Confirmation: The price smashes through a resistance zone, and you see a massive spike in volume at the same time. This confirms buyers mean business.
- Pattern Breakout: The price finally breaks out of a clean consolidation pattern you've been watching, like a bullish flag or a descending wedge.
When you define your trigger ahead of time, you eliminate the guesswork. You’re not reacting emotionally to every little price flicker; you’re executing a plan when the market finally meets your conditions.
Setting Your Hard Stop-Loss
Your stop-loss is your emergency eject button. It's the price level where you admit your trade idea was wrong, take a small, calculated loss, and live to fight another day. For anyone serious about surviving in crypto markets, setting a stop-loss is non-negotiable.
So, where do you put it? The most logical spot is just beyond the point that invalidates your entire reason for taking the trade.
Actionable Example: If you're buying a bounce off a support level at $50, your stop-loss belongs just below that level, perhaps at $48.50. Why? Because if the price breaks that floor, your whole thesis—that buyers will defend $50—is proven wrong. Sticking around after that isn't trading; it's just hoping.
A hard stop-loss is an order you place with the exchange the moment you enter a trade. It’s crucial because it stops you from committing the classic trader sin: moving your stop further down "just in case" it turns around. That's how small losses spiral into account-killers.
Establishing Clear Profit Targets
Just like you need an exit plan for when you're wrong, you need one for when you're right. Profit targets are pre-set price levels where you'll cash in some or all of your gains. This is how you combat greed—that little voice telling you to hold on for more, right before the market reverses and turns a great trade into a loser.
Good targets are based on the chart's structure, not some random dollar amount you want to make. Look for the next obvious roadblock.
- Is there a previous high where sellers slammed the price down before?
- Is a major moving average sitting right overhead?
- Does a Fibonacci extension level line up perfectly with an old pivot point?
Actionable Example: You buy a breakout above resistance at $100. The previous major high on the daily chart was at $120. That $120 level is a logical, structure-based profit target. Set an order to sell a portion of your position there, regardless of how bullish you feel when the price approaches it.
These are the spots where the market is likely to stall. They make for perfect, logical places to take your money and run.
A Practical Walkthrough with a Sample Trade
Let's tie this all together. Imagine we're looking at a long trade on Solana (SOL/USDT).
High-Timeframe Context (Daily Chart): First, we zoom out. On the daily chart, SOL is in a clear uptrend, holding strong above its 50-day moving average. Price has just pulled back to a key horizontal support zone around $140, an area where we've seen buyers jump in before. Our big-picture bias is bullish.
Fine-Tuning the Entry (1-Hour Chart): Now we zoom in to the 1-hour chart to pinpoint our entry. We can see the price coiling up and consolidating right above that $140 support. Our trigger will be a clean, confirmed breakout above the top of this small range, which is at $145.
Building the Plan:
- Entry Trigger: We will enter the trade once a 1-hour candle closes decisively above $145.
- Stop-Loss: We’ll place our stop at $138, giving the $140 support zone some breathing room. If $138 breaks, our bullish idea is clearly wrong.
- Profit Target: Looking back at the daily chart, the next major resistance level is sitting at $165. That's our target.
This simple plan gives us a risk-to-reward ratio of about 1:2.8. We're risking $7 per SOL to potentially make $20. This is the kind of math that builds winning accounts. Even if you're only right half the time, a favorable ratio like this ensures your winners more than cover your losers. This is how you move from just reading charts to trading them like a pro.
A pre-trade checklist is your personal standard operating procedure. It's the simple tool that ensures you've thought through every angle before you click "buy." To make this concrete, here's a sample checklist you can adapt for your own trading style.
Sample Pre-Trade Checklist
| Checklist Item | Example (ETH/USD Long Trade) | Purpose |
|---|---|---|
| Market Trend (HTF) | Daily chart shows ETH is above the 50-day EMA, in an uptrend. | Ensures you are trading with the dominant market momentum. |
| Key Levels Identified | Support at $3,000, Resistance at $3,300. | Defines the "playing field" for your trade. |
| Trade Thesis | "Price has pulled back to major support at $3,000. I expect a bounce." | Forces you to articulate exactly why you're taking the trade. |
| Entry Trigger | A bullish engulfing candle closes on the 4-hour chart at the $3,000 level. | Creates a specific, non-emotional condition for entry. |
| Stop-Loss Placement | $2,940 (just below the support level and recent swing low). | Defines your maximum acceptable loss and invalidation point. |
| Profit Target(s) | Target 1: $3,150 (minor resistance), Target 2: $3,280 (near major resistance). | Pre-defines where you will lock in gains. |
| Risk/Reward Ratio | Risk: $60. Reward (to Target 2): $280. Ratio is ~1:4.6. | Confirms the trade is mathematically worthwhile. |
| Position Size | Based on my account size, a $60 risk allows for a position of X ETH. | Ensures you never risk more than a pre-determined % of your capital. |
By running through a checklist like this every single time, you build the kind of discipline and consistency that separates successful traders from the crowd. It turns trading from a gamble into a structured business.
Learning from Historical Chart Patterns
The day-to-day chaos of the crypto market can feel completely random. But if you zoom out, you'll find that history is a fantastic teacher. Past price action offers a roadmap, showing us exactly how markets react during cycles of extreme greed and crippling fear.
Studying these past cycles isn't about finding a crystal ball to predict the future. It’s about recognizing the psychological patterns that play out time and time again. Once you’ve seen what a full-blown bull run and the subsequent crash actually look like on a chart, you're far better prepared to manage your own emotions when history inevitably starts to rhyme.
The Four Phases of a Market Cycle
Whether you're looking at crypto, stocks, or any other market, you’ll notice that major cycles tend to unfold in four distinct phases. Being able to identify the current phase is a huge strategic edge.
Accumulation: This is the quiet after the storm. Following a massive crash, the price just drifts sideways. It's boring. This is when the smart money and long-term believers start buying, or "accumulating," from traders who are emotionally exhausted and just want out. Volume is usually dead, and the general mood is a mix of apathy and despair.
Markup: This is the part everyone loves—the bull run. The price finally breaks out of that sideways grind and kicks off a strong, sustained uptrend. Public interest explodes, the news turns overwhelmingly positive, and FOMO (Fear Of Missing Out) sends prices parabolic.
Distribution: At the top, the party starts to wind down. Price action gets choppy and messy, often whipsawing back and forth in a wide range. The same smart money that bought during accumulation is now quietly selling their positions to the euphoric crowd rushing in at the peak. Sentiment is at an all-time high, but the real momentum is gone.
Markdown: And then comes the bear market. The price finally breaks down from the distribution range, and a painful downtrend begins. Panic sets in as latecomers are forced to sell at a loss. This phase grinds on until the sellers are completely exhausted, which sets the stage for the next accumulation phase to begin.
Actionable Insight: Knowing these phases helps you answer the single most important question you can ask as a trader: "Is this dip a buying opportunity, or is it the start of something much worse?" If you’re clearly in a markup phase (bull run), a dip to the 50-day moving average is often a prime buying opportunity. But if you’re seeing the warning signs of distribution (choppy price action at all-time highs), that same dip might be your last chance to get out before the markdown phase begins.
A Historical Case Study: The 2017 Bitcoin Cycle
Want to see these phases in the wild? Look no further than Bitcoin’s legendary 2017 run. Crypto chart analysis really came into its own during these cycles, as the volatility tested even the sharpest traders.
Back in 2017, BTC went on an absolute tear, rocketing from about $800 to nearly $20,000. That’s a mind-boggling 2400% gain. Of course, it didn't last. By December 2018, it had crashed all the way back down to around $3,100, wiping out 84% of its value from the peak. This entire story is a perfect lesson in market dynamics, and you can see the data for yourself to learn more about these volatile market cycles.
The markup was a textbook uptrend—a beautiful staircase of higher highs and higher lows that lasted for months. The distribution near $20,000 was classic: extreme volatility, a failure to push to new highs, and then the inevitable breakdown. The 2018 markdown that followed was a slow, painful bleed-out that lasted an entire year.
By digging into these historical charts, you start to develop a real feel for the market’s rhythm. You learn what a true top looks and feels like, and you internalize the fact that parabolic moves almost never end well. This historical context becomes your anchor, keeping you grounded when everyone else is either panicking or popping champagne too early.
Common Questions When Reading Crypto Charts
Once you start moving from books and videos to live charts, you'll inevitably run into the same hurdles every trader faces. Learning to read the market's language is a process, and these common questions are part of that journey. Let's tackle them head-on with some practical, no-nonsense advice.
What’s the Best Timeframe to Use?
Honestly, there's no "best" timeframe. The right one comes down to your personality and trading style. A scalper who thrives on minute-by-minute action has a completely different need than a swing trader who checks their positions once or twice a day.
- For Day Traders: You live and breathe on the lower timeframes. Think 5-minute, 15-minute, and 1-hour charts. These are where you'll find the granularity needed to execute on those quick, intraday price swings.
- For Swing Traders: You need to see the bigger picture. The 4-hour, daily, and even weekly charts are your go-to. They help you spot the larger, more powerful trends that can play out over several days or weeks.
But here’s a pro tip: don't just pick one. The real edge comes from using them together in what's called multi-timeframe analysis.
Actionable Example: I always start my analysis on a higher timeframe, like the daily, to get a clear read on the dominant trend. Is the market pushing up, or is it in a clear downtrend? Once I have that context, I'll drill down to a lower timeframe, maybe the 1-hour or 4-hour, to find a precise entry that aligns with that larger momentum. For instance, if the daily chart is in a strong uptrend, I will only look for buy signals on the 1-hour chart, completely ignoring sell signals. This simple habit keeps you from fighting the current.
How Do I Stop Over-Complicating My Charts?
Ah, analysis paralysis. This is a classic trap. You find one cool indicator, then another, and before you know it, your chart is a chaotic mess of lines and signals, leaving you completely frozen.
The fix is surprisingly simple: get rid of almost everything. Your objective isn't to find some magical combination of indicators that perfectly predicts every move—that's a fantasy. The goal is to build a clean, consistent system that gives you a slight statistical edge over hundreds of trades.
Instead of ten different tools all screaming at you, pick just 2 or 3 that work well together. A simple, powerful stack I’ve seen work for years includes:
- Trend: A couple of Moving Averages (the 50 and 200 EMA are classics) to tell you which way the market is leaning.
- Momentum: The Relative Strength Index (RSI) to see if a move is running out of steam or just getting started.
- Volume: This is non-negotiable. It’s your truth serum, confirming whether there’s real conviction behind a price move.
Get to know these few tools inside and out. Master their quirks. This focused, minimalist approach will serve you far better than a shallow understanding of twenty different indicators.
Are Chart Patterns Actually Reliable in Crypto?
Yes, they absolutely can be—but with one massive asterisk. Classic patterns like triangles, flags, and head-and-shoulders are not crystal balls and should never be traded in a vacuum.
These patterns work because they are visual representations of market psychology, and human behavior is just as present in crypto as it is in stocks or forex. However, their reliability shoots up when you get confirmation from other sources.
Think of a chart pattern as a suggestion, not a command. Before you even think about putting money on the line, look for confluence—that’s just a fancy word for multiple, separate signals all pointing in the same direction.
Actionable Example: Let's say you spot a nice, clean bullish flag forming on the 4-hour Bitcoin chart. That's a potential signal that the price wants to continue higher. A rookie might jump in right away, but a seasoned trader waits for more evidence:
- Where is it forming? Is this flag appearing just above a known support level or a key moving average? A pattern in a strong location is much more powerful.
- What's the volume doing? Did volume dry up as the flag formed? That’s a textbook sign of a healthy consolidation before the next leg up.
- How did it break out? When the price finally broke out of the pattern, was it on a big spike in volume? That’s your confirmation that buyers are back in control and mean business.
When you have the pattern, the location, and the volume all telling you the same story, your odds of a successful trade improve dramatically.
Navigating crypto charts is one thing, but turning that analysis into a concrete trading plan is another. Instead of relying on indicators that only show you what already happened, what if you could see forward-looking projections laid right over your chart?
CryptoMox does just that, using AI to provide projected price paths and conviction bands to help you plan your entries, stops, and targets with military-grade discipline. See how our transparent confidence scores can give you a repeatable edge. Start your secure 7-day trial at CryptoMox.